VPC Says:'Pro-gun'States With "Weak"Gun Laws Have the Highest Homicide Rates

Status
Not open for further replies.

Winchester 73

member
Joined
Apr 10, 2007
Messages
1,576
Location
Miami,Florida
'Pro-Gun' States Lead the Nation in Per Capita Firearm Death Rates

http://www.prnewswire.com/cgi-bin/stories.pl?ACCT=104&STORY=/www/story/04-24-2008/0004799853&EDATE=

Violence Policy Center Analysis of New Data Reveals Louisiana, Alaska,
Montana, Tennessee, and Alabama Top List of Deadliest States in the Nation


Blind Allegiance to the Second Amendment Takes Deadly Toll


WASHINGTON, April 24 /PRNewswire-USNewswire/ -- States in the South and
West with weak gun laws and high rates of gun ownership lead the nation in
overall firearm death rates according to a new analysis issued today by the
Violence Policy Center (VPC) of Centers for Disease Control and Prevention
(CDC) data.


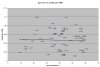
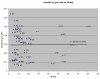
The new VPC analysis uses 2005 data (the most recent available) from
the CDC's National Center for Injury Prevention and Control. The analysis
reveals that the five states with the highest per capita gun death rates
were Louisiana, Alaska, Montana, Tennessee, and Alabama. Each of these
states had a per capita gun death rate far exceeding the national per
capita gun death rate of 10.32 per 100,000.


By contrast, states with strong gun laws and low rates of gun ownership
had far lower rates of firearm-related death. Ranking last in the nation
for gun death was Hawaii, followed by Massachusetts, Rhode Island, New
Jersey, and New York. (See list below or chart at
http://www.vpc.org/press/0804gundeath.htm for states with the highest and
lowest gun death rates. See http://www.vpc.org/fadeathchart.htm for a
ranking of all 50 states.)


States with the Five HIGHEST Per Capita Gun Death Rates


Louisiana--Rank: 1; Household Gun Ownership: 45.6 percent; Gun Death
Rate: 19.04 per 100,000.


Alaska--Rank: 2; Household Gun Ownership: 60.6 percent; Gun Death Rate:
17.49 per 100,000.


Montana--Rank: 3; Household Gun Ownership: 61.4 percent; Gun Death
Rate: 17.22 per 100,000.


Tennessee--Rank: 4; Household Gun Ownership: 46.4 percent; Gun Death
Rate: 16.39 per 100,000.


Alabama--Rank: 5; Household Gun Ownership: 57.2 percent; Gun Death
Rate: 16.18 per 100,000.


States with the Five LOWEST Per Capita Gun Death Rates


Hawaii--Rank: 50; Household Gun Ownership: 9.7 percent; Gun Death Rate:
2.20 per 100,000.


Massachusetts--Rank: 49; Household Gun Ownership: 12.8 percent; Gun
Death Rate: 3.48 per 100,000.


Rhode Island--Rank: 48; Household Gun Ownership: 13.3 percent; Gun
Death Rate: 3.63 per 100,000.


New Jersey--Rank: 47; Household Gun Ownership: 11.3 percent; Gun Death
Rate: 4.99 per 100,000.


New York--Rank: 46; Household Gun Ownership: 18.1 percent; Gun Death
Rate: 5.28 per 100,000.


VPC Legislative Director Kristen Rand states, "Blind allegiance to the
Second Amendment comes at a deadly price. Many residents in pro-gun states
cheer the possibility of a June Supreme Court ruling that could place gun
controls across the nation at risk, never realizing that those states stand
as proof of the need for such laws."

The VPC defined states with "weak" gun laws as those that add little or
nothing to federal restrictions and have permissive concealed carry laws
allowing civilians to carry concealed handguns. States with "strong" gun
laws were defined as those that add significant state regulation in
addition to federal law, such as restricting access to particularly
hazardous types of firearms (for example, assault weapons), setting minimum
safety standards for firearms and/or requiring a permit to purchase a
firearm, and have restrictive concealed carry laws.

The Violence Policy Center (http://www.vpc.org) is a national educational
organization working to stop gun death and injury.
 
Wow, why am I always shocked by their biased and faulty statistics.

More people get killed by a firearm when there are more firearms.

Not everyone who gets killed is innocent.

Suicides by gun are not worse than suicides by gravity.


A better question is: are there more HOMICIDES per capita in states with high gun ownership rates?

I'm betting (I know) it's no.

Another question is: are suicide rates higher in states with more gun ownership?

Again, I'm betting (I know) it's no.


Awful, just awful.
 
A quick use of WISQARS for simple homicide deaths (not necessarily gun-related) gives:

(entries are in form STATE: murders/population:gross rate)

AK: 37/663,253: 5.58
MO: 33/934,737: 3.53
TN: 495/5,955,745: 8.31
AL: 433/4,548,327: 9.52
LA: 592/4,507,331: 13.13

HA: 25/1,273,278: 1.96
MA: 178/6,433,367: 2.77
RI: 32/1,073,579: 2.98
NJ: 427/8,703,150: 4.91
NY: 901/19,315,721: 4.66

The margin is, of course, less. I checked similar data for suicides, and it looks like the rates in the "gun-free" states are also a bit less.

I wonder how they picked the states, though. That's probably the key to this problem.

WISQARS is publicly available at http://www.cdc.gov/ncipc/wisqars/

It's fun to play around with.
 
Here's my THR thread on this very subject. She's wrong.

http://thehighroad.org/showthread.php?t=292650

covcrwk0.jpg


Note that on the left half of the graph are states considered "firearms unfriendly", and in those states an increase in firearm ownership is correlated with increased crime rate. The rest of the country is on the right half.
 
VPC Legislative Director Kristen Rand states,..."Many residents in pro-gun states
cheer the possibility of a June Supreme Court ruling that could place gun
controls across the nation at risk, never realizing that those states stand
as proof of the need for such laws."

These people are absolutely pissed that Heller more than likely won't go their way.

Their pooh poohing is full of lies of course.
 
Last edited:


I don't know if Dougie Weil is still Minister of Propaganda at VPC, but this smells like his "work."

Total homicide rates per 100K from the 2005 FBI UCR, Table 4, for the year 2005:

LA 9.9
Alaska 4.8
Montana 1.9
Tenn 7.2
Alabama 4.8

 
csmkersh, I wonder why the FBI numbers are so different from the CDC numbers. There's a big difference in some of those rates.

jlbraun, nice plot, (I think I saw it before in that thread you mentioned) but I have a feeling that if you set up a trendline (and exclude DC), the slope won't be statistically significant. Even with DC, the slope probably won't be statistically significant.

However, if you were to weight each point based on state population, you might find something significant.

Of course, there are a million ways to look at this. If, for instance, firearms are used for self-defense ~750,000 times a year (by the most conservative estimates), I'll bet there is a very good correlation between gun ownership and defensive use. That is, places with no lawful ownership show little defensive use.

Another point--their figures for ownership probably include only lawful ownership.
I wonder what happens when you remove all murders commited by unlawful possessors of firearms. (E.g. John Q. Gangmember's illegally procured pocket pistol) (Or, what happens if your "possession" rate adds in illegal guns?)

I wonder how much the murder rate drops when you only consider when people who are in legal possession of the gun use it. I'll bet it plummets like a rock.

Ah! I didn't even notice that the VPC omitted DC! I'll bet that data point doesn't fit their conclusion!
 
In any case, this is an observational study, not a controlled experiment. For an example of the dangers of trusting the former, observe the history of the Philips Curve.
 
Rudy Kohn said:
csmkersh, I wonder why the FBI numbers are so different from the CDC numbers. There's a big difference in some of those rates.

The only logical explanation would be that the FBI is using the number that the VPC is really looking for, homicides. Whereas the CDC is using all firearm related deaths, to include self defense, suicide, accidents, etc. I'm pretty sure the FBI was including all homicides also, not just firearms related homicides. --edited cause I was wrong --

When the numbers don't say what you want, use different numbers.
 
The more logical explanation is that CORRELATION DOES NOT EQUAL CAUSATION!! Any statistician who's worth a damn could find ways of massaging and manipulating the data until it did exactly what they wanted it to show. And also, without some type of analysis and experiment to go along with it, the data is worthless...and let's not even begin to touch the matter of statistical significance. Also, didn't FBI release a report not too long ago which said that no link at all could be found between laws prohibiting assault weapons and reduction in violent crime?
 
I notice they didn't use the District of Columbia stats which are a "crude rate" of 30.93 deaths per 100K!!

The idea that where I live (Montana) is one of the most dangerous places in America to live is ludicrous.

Instead of cherry picking the numbers. Just sort by homicide rates and take the lowest 5 states and the highest 5 states.

rates.jpg

Homicide rates taken from "2005, United States Homicide Injury Deaths and Rates per 100,000" published by CDC on 2005 Data.

Brady ratings taken from "2007 Brady Campaign State Scorecard"


Move along folks, no story here...except that VPC doesn't care about truth or reality, just their point of view.


csmkersh, I wonder why the FBI numbers are so different from the CDC numbers. There's a big difference in some of those rates.

There may be two things going here. One innocent and one not.

The innocent may be a different database the the FBI UCRs.

The not so innocent is CDC's long bad reputation of being anti-gun. They funded more than one "study" by Prof. Kellermann who promptly mis-stated his findings and withheld his data from peer review.

Back to VPC and their "numbers." They flat freaking lie. WISQARS will give you firearms related homicides (NOT MURDER) if you ask it properly.

Here are the States I pulled FBI stats from and now provide the CDC's data from 2005. Oh, and I've added Washington DC. Format is total homicides, population, crude rate per 100K and age adjusted rate:

LA 457 4,507,331 10.14 9.8
Alaska 24 663,253 3.62 3.29
Montana 17 934,737 1.82 1.78
Tenn 371 5,955,745 6.23 6.22
Alabama 319 4,548,327 7.01 7.15
District of Columbia 142 582,049 24.4 21.59

It's been illeagal to own/possess an unregistered handgun in DC since 1977.

Sort of makes one question the veracity of CDC. Naw, I know VPC lies. Dealt with them before.

Oh, minor request. Call me Sam or Sergeant Major. Your choice.
 
States in the South and
West with weak gun laws and high rates of gun ownership lead the nation in
overall firearm death rates

Cherry picking. First, "firearm death" is meaningless. You want to look at the overall murders and violent crime:
 

Attachments

  • gun own vs brady.jpg
    gun own vs brady.jpg
    60.7 KB · Views: 53
  • mbg vs brady.jpg
    mbg vs brady.jpg
    69.2 KB · Views: 55
Folks, lets all remember there is only ONE inaccurate math and thats called "statistics"

Stats can be manipulated to say anything you want!
 
one death in ten people is 10%

one death in New York City is 0.0000000000000001%

big difference there.
 
I suggest an excellent book called "How to Lie with Statistics" by Darrell Huff and Irving Geis. After reading it (about 2 hours if you don't move your lips when you read) you will never be taken in by numerical guano again.
 
The CDC study makes no distinction between justifiable homicide(including cops) and criminal homicides. It also puts firearm deaths at #15 in the top 15. Suicide is #11 and accidents is #5.
 
Homicide rates

Don't forget to separate the gang violence from the other forms of murder. Most gang violence and for that matter most deaths by guns come from those who are forbidden by law (felons) who can't legally own guns. And they didn't purchase those guns legally.

I live in Delaware and the city of Wilmington has had 11 murders so far this year. All were committed by gang on gang violence. None of the guns were legally purchased and most of those killing others were already felons.

If we remove (separate) those numbers from the self defense,suicide and killing a spouse we end up with a totally different view.

If you actually separate into all the different categories gang violence is at the top of the list and self defense at the bottom.

The government seems unwilling to punish the criminals or patrol high crime areas. Having the felons killing other felons does what the law seems unwilling to do. Get rid of evil people.


comparing incredibly densely populated area rates like NY with sparse areas like MT?? shenanigans!
No, all rates stated are in per 100,000 population. Which negates the density "problem."

What isn't noted because it's "racist" is that areas with a certain high minority population have an out of norm violent crime rate. Specifically, 12.5% of the US population committ the same volume of crime as the 82.5% white population. That's per the FBI UCR for 2005 Expanded Homicide Data Table 1.
 
What isn't noted because it's "racist" is that areas with a certain high minority population have an out of norm violent crime rate. Specifically, 12.5% of the US population committ the same volume of crime as the 82.5% white population. That's per the FBI UCR for 2005 Expanded Homicide Data Table 1.

Now,the cat is out of the bag.This is the statement I've been waiting for.
Thank you,Mr Kersh.
And 90% of black homicides are black on black.53% of the U.S total homicide rate is black.
Hispanics making up 14% of the U.S. population commit 24% of the homicides.
Caucasians making up 73% of the U.S.population commit 22% of the homicides.
PC is our biggest curse today.See these stats:

http://www.ojp.usdoj.gov/bjs/homicide/race.htm
 
That's like the argument that the "gun hating northeast" has lower crime rates than the "gun loving south or west" argument. When you look at the Brady Campaign grades for the Northeast states, three are gun hating: MA, CT and RI (their laws get Brady Grades in the A- to B- range) and three are gun loving: ME, VT and NH (all getting a D- Brady grade). Check out the FBI UCR rates of violent crime and homicide per 100,000 population per year:
Code:
[SIZE=3]State Brady Campaign Ratings v FBI UCR Crime and Homicide Rates
Northeastern US          2003              2006
STATE        GRADE  CRIME  HOMICIDE   CRIME  HOMICIDE    
Connecticut    A-   308.2    3        280.8    3.1
Maine          D-   108.9    1.2      115.5    1.7
Massachusetts  A-   469.4    2.2      447.0    2.9 
New Hampshire  D-   148.8    1.4      138,7    1,0    
Rhode Island   B-   285.6    2.3      227.5    2.6
Vermont        D-   110.2    2.3      136.6    1.9[/SIZE]
Correlation may not equal causation, but lax gun laws do not guarantee high crime or homicide rates, and vice versa.
 
Status
Not open for further replies.
Back
Top